
Risk Analytics Methodology
Mining IQ Risk Analytics is an interactive database that provides insights into the mining investment risk landscape. The aim is to provide a clear, consistent and detailed view of mining investment risk across more than 110 jurisdictions worldwide.
Mining IQ has partnered with legal consultancy MineHutte, which provides ratings data for several risk metrics outlined in the Indicators list. For more information, visit www.minehutte.com. The methodology has evolved from an initial industry consultation conducted in 2017. Please email sam.williams@aspermont.com if you have any questions or feedback.
Risk categories
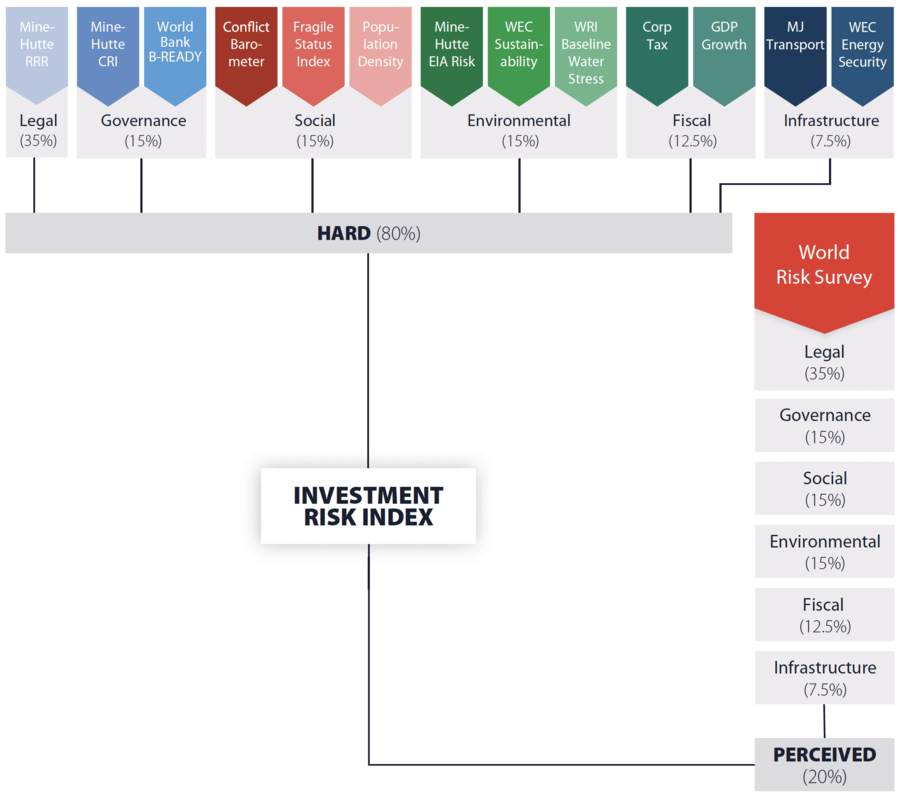
Risk is assessed across 13 indicators within six weighted risk categories:
Legal (35% of total risk scores): Evaluates the ability of mining legislation to protect investment
Governance (15%): Assesses the ease of doing business and risks associated with corruption.
Social (15%): Assesses underlying political and social tensions and the risk of unrest, protests, activism or violent conflict.
Environmental (15%): Assesses risks associated with competition over water resources, environmental permitting and access to low-carbon electricity.
Fiscal (12.5%): Considers how punitive the tax structure is and general economic health.
Infrastructure (7.5%): Assesses energy security and infrastructure provision.
Hard Risk and Perceived Risk
Each indicator is assessed using two elements:
- Hard Risk, based on the latest ‘hard' data from the external and internal source as described in the Indicators list, which include Mining IQ's data partner, MineHutte.
- Perceived Risk, based on responses from the Mining IQ World Risk Survey.
(There are three exceptions: The Population density indicator is based purely on Hard data, and mining-specific taxes and royalties is a purely Perceived Risk indicator. This year, the World Bank B-READY scores were replaced by Perceived Risk ratings due to limited global coverage – see Indicators list for details).
Hard risk focus
Our methodology places greater emphasis on Hard than Perceived Risk, with the Hard element making up 80% of total risk scores and Perceived Risk weighted at 20%.
This approach provides a firm foundation in robust, high-quality data, adding the extra ‘dimension' of risk perceptions from the mining community while limiting the potential impact of bias, manipulation and shifting respondent demographics in the survey.
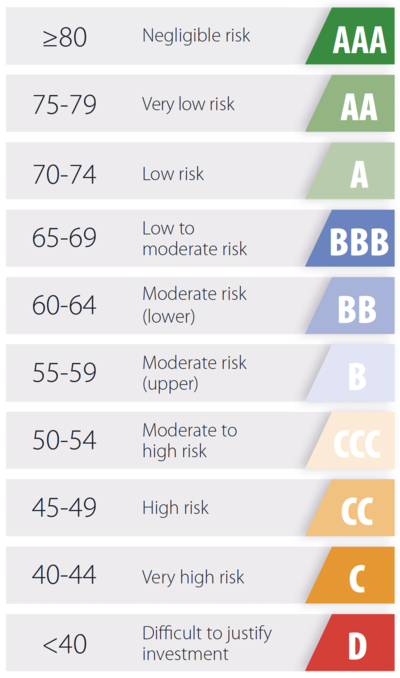
1-100 Scale, Ratings
Overall risk is measured on a 1-100 scale, with higher scores meaning lower risk. Risks in each of the six categories and 13 individual indicators are scored on the same 1-100 scale.
Scores correspond to ratings from AAA (for those with negligible investment risk and scores of 80.0 or above) to D, for those with exceptionally high risk and scores below 40.0.
World Risk Insights Methodology Infographic
World Risk Insights Risk Ratings Infographic
Indicators list
Legal
MineHutte Regulatory Risk Ratings (35% of total risk): These measure an investor's risk of losing the economic benefits of a mineral discovery based solely on a jurisdiction's regulatory framework. The ratings consider 17 elements within mining-relevant legislation.
RRR scores are on a 1-100 scale, with higher scores meaning lower risk, and are incorporated in the World Risk Index unchanged.
Governance
MineHutte Corruption Exposure Risk Index (12.5%): The CER is the result of a mathematical screening of MineHutte's Regulatory Corruption Risk Index through the lens of the Economist Intelligence Unit's Democracy Index.
CER scores are on a 1-100 scale, with higher scores meaning lower risk, and are incorporated in the World Risk Index unchanged.
World Bank Business Ready (B-READY) (2.5%): The World Bank published the first edition of its Business Ready (B-READY) report in 2024, replacing its previous Ease of Doing Business rankings, which were last updated in 2019. Only 50 countries globally were assessed (and a small fraction of Mining IQ's assessed jurisdictions), so we relied 100% on Perceived Risk scores from survey results to assess this metric in 2024. We will seek to incorporate B-READY scores once an expanded list of countries is assessed.
Social
Fund for Peace Fragile States Index (5%): Assesses a jurisdiction's vulnerability to conflict or collapse, ranking all 193 members of the United Nations.
Original scores are out of 120 with a low score being more stable. Scores were divided by 120 and subtracted from 100, so a higher number reflects greater stability.
Heidelberg Conflict Barometer (5%): The Heidelberg Institute for International Conflict Research (HIIK) analyses conflicts focusing on processes rather than purely quantitative thresholds of war casualties. The Conflict Barometer measures conflict intensity.
Conflicts are rated from 1-5 in severity, with 5 being the most severe. Where no conflict was reported a rating of 0 was given. Ratings are multiplied by 20 and subtracted from 100 so that higher final scores reflect greater peacefulness.
Population density (5%): People per sq.km of land reflecting the fact mining projects are more difficult to progress in areas of greater population density. This is a purely Hard Risk metric, with no Perceived Risk element.
Population per sq.km was adjusted to give a score of 0-100, with 100 the least dense and 0 reflecting density above 200/sq.km.
Environmental
MineHutte EIA Approval Risk (5%): Analyses the legal regime applicable to the EIA process and assesses the ability of decision-makers to arbitrarily or discretionarily deny an EIA permit.
EIA Approval Risk scores are on a 1-5 scale, with higher scores meaning lower risk, and are multiplied by 20 to give scores out of 100.
World Resources Institute Baseline Water Stress (5%): Baseline Water Stress from the WRI's Aqueduct tool measures the ratio of total water demand to available renewable supplies to indicate the level of competition mining companies will face over water resources.
Baseline Water Stress data was taken from the Aqueduct Country Ratings, which is reported on a 0 to 5 scale, with 5 being the highest stress level. The data was multiplied by 20 and then subtracted from 100 so that higher scores mean lower water stress.
World Energy Trilemma Index, Environmental sustainability (5%): Produced by the World Energy Council (WEC), this scores nations' progress in avoiding environmental harm and climate change impacts from energy production. Access to low-carbon power will be vital for mining companies to meet their climate commitments, something investors are increasingly demanding.
WEC Environmental sustainability scores are on a 1-100 scale, with higher scores reflecting a stronger performance. The scores were incorporated in the World Risk Index unchanged.
Fiscal
Corporate tax rate (5%): Used as a general measure of tax burden.
Corporate tax rates, sourced from the Tax Foundation and expressed as percentages, were subtracted from 100 so that lower tax rates gave higher scores out of 100.
Mining-specific taxes/royalties (5%): No Hard Risk element. Total scores are based on Perceived Risk, calculated from Mining IQ World Risk Survey responses.
GDP growth (2.5%): A measure of economic health, reflecting the fact that governments of jurisdictions with ailing economies tend to pursue tax hikes targeting extractive industries.
Annual real GDP growth figures were sourced from the IMF and compared, with 10% or higher growth receiving the maximum score of 100.
Infrastructure
Mining Journal Transport Infrastructure Index (3.75%): An in-house measure of the standard of transport infrastructure, based on an assessment of rail, roads, and ports provision, using data sourced from the CIA World Factbook and official public sources for sub-national jurisdictions in Australia, Canada and the US.
Scores are provided out of 100, with higher scores reflecting better infrastructure provision, and were incorporated in the World Risk Index unchanged.
World Energy Trilemma Index, Energy security (3.75%): Scores nations' capacity to reliably meet energy demand and minimise disruption to supply.
WEC Energy security scores are produced on a 1-100 scale, with higher scores reflecting a stronger performance. The scores were incorporated in the World Risk Index unchanged.
Perceived Risk
Perceived Risk is measured through Mining IQ's World Risk Survey, which asks mining professionals to rate jurisdictions they are familiar with out of 10 across the relevant risk indicators. Higher scores mean lower risk or better performance/provision.
The Perceived Risk indicators, broken down by risk category, that survey respondents were asked to rate, are:
Legal: Mining code
Governance: Transparency; Ease of doing business
Social: Political stability; Physical conflict/safety
Environmental: EIA approval risk; Water availability; Access to low-carbon electricity
Fiscal: Mining-specific requirements (royalties, mandatory government participation, etc), Business tax (not mining-specific); Economic prosperity
Infrastructure: Rails, roads, ports; Energy security
Average scores for each indicator were multiplied by 10 to give figures on a 1-100 scale. The 2024 survey was completed by 439 respondents, who were asked to rate up to three jurisdictions.