
Risk Analytics Guide
Methodology
For a full explanation of the methodology behind the data included in Mining IQ Risk Analytics, visit the dedicated methodology page. It includes information on Risk Categories, the distinction between Hard and Perceived Risk, our focus on Hard Risk, our Risk Ratings, and our approach to updating and adding commentary on data you can explore.
Visit the Risk Methodology page
Logging into Mining IQ Risk Analytics
To access Mining IQ Risk Analytics visit www.mining-iq.com/focus/risk/risk-analytics
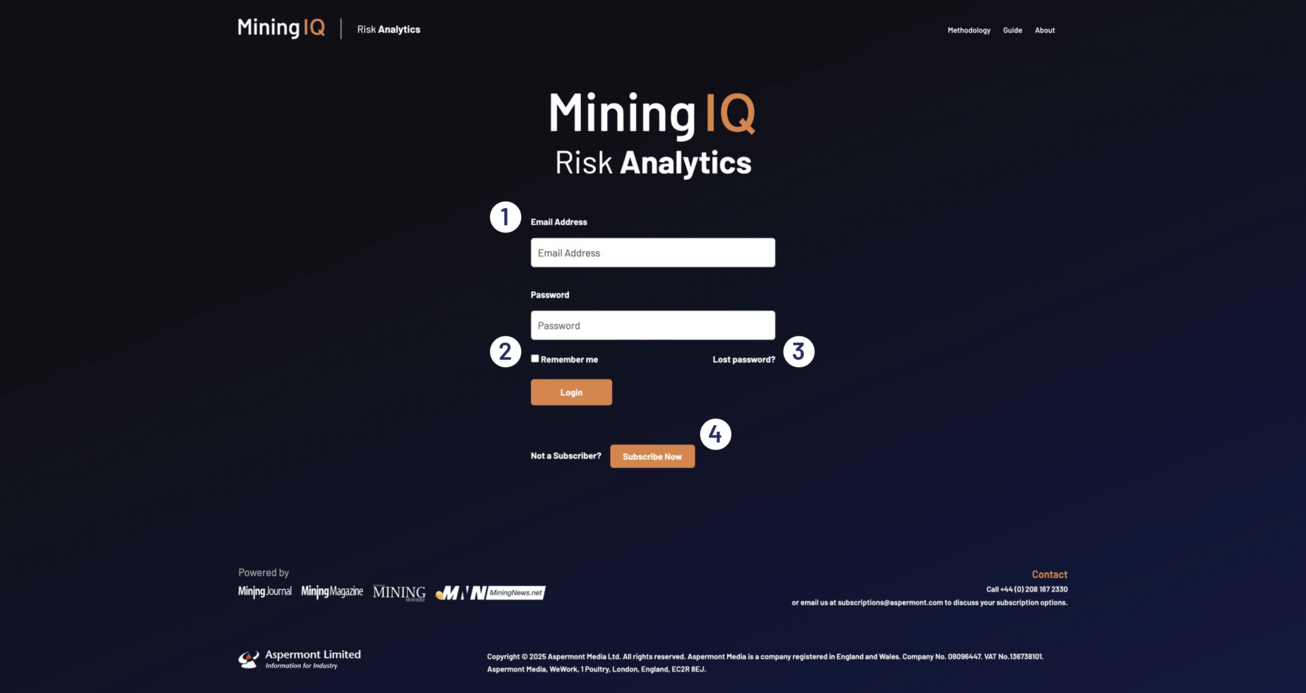
- If you are an existing subscriber who has upgraded for access to Mining IQ Risk Analytics, please log in using your existing Username and Password. If you are a new customer without a pre-existing subscription, please log in with the username and password you defined during the subscriptions process.
- If you would like your web browser to remember your username so that you need only enter your password when logging in, check the ‘Remember me' box below the password field.
- If you have forgotten or lost your password, click ‘Lost password' to begin the password recovery and update process.
- To find out more about how to begin a subscription which includes Mining IQ Risk Analytics, click ‘Subscribe now'.
Navigate Mining IQ Risk Analytics
The Mining IQ Risk Analytics tool comprises three sections: a World Page, a Region Page, and a Jurisdiction Page. While you use the tool, those options will appear on all pages, enabling you to navigate between them. Each page is covered in detail below.
WORLD PAGE VIEW
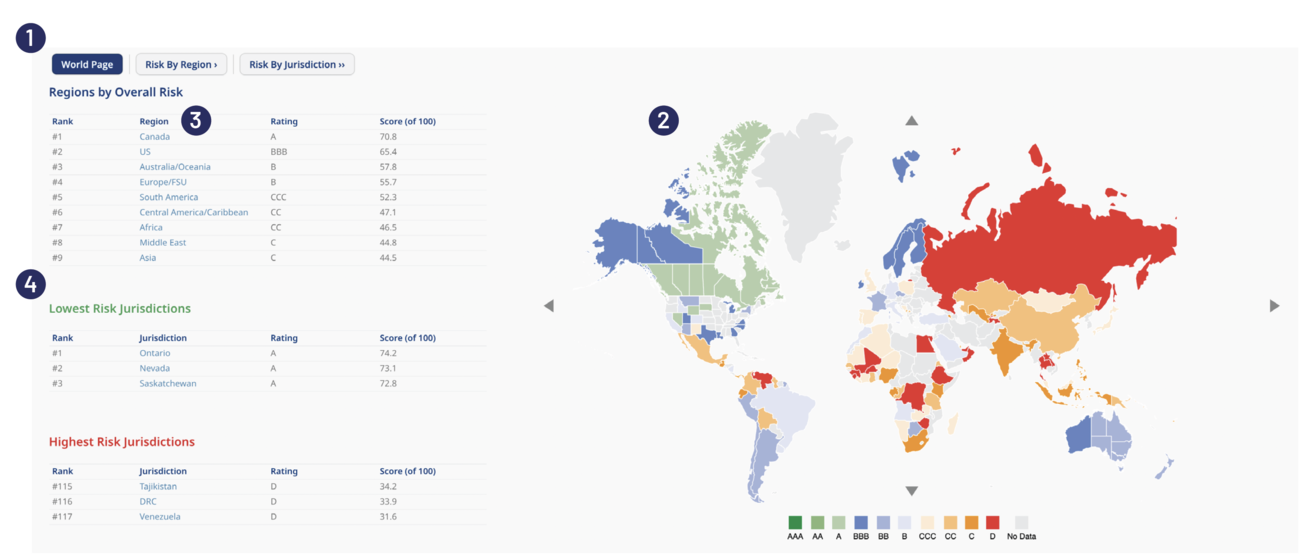
- Buttons that allow free navigation to the region and jurisdiction pages. Clicking on these buttons will select the first alphabetical region or jurisdiction to be presented.
- World map with the overview of scores given to all jurisdictions. It can be panned and zoomed. Hovering over any jurisdiction on this map will provide a tooltip giving score details. Clicking on any area will take you to the corresponding region page.
- Each region in this table contains an aggregated score from all their jurisdictions. Clicking on a name takes you to the corresponding region page.
- The top-three highest and lowest risk jurisdictions and their scores. Clicking on a name takes you to the corresponding jurisdiction page.
VIEWING OUR RISK SCORES
Below the map on the World Page, the next section provides a detailed breakdown of the risk scores and their subcomponents. All raw data points have been converted to a score out of 100 to easily compare with other data points for the jurisdiction and with other jurisdictions.
They will typically follow this structure:
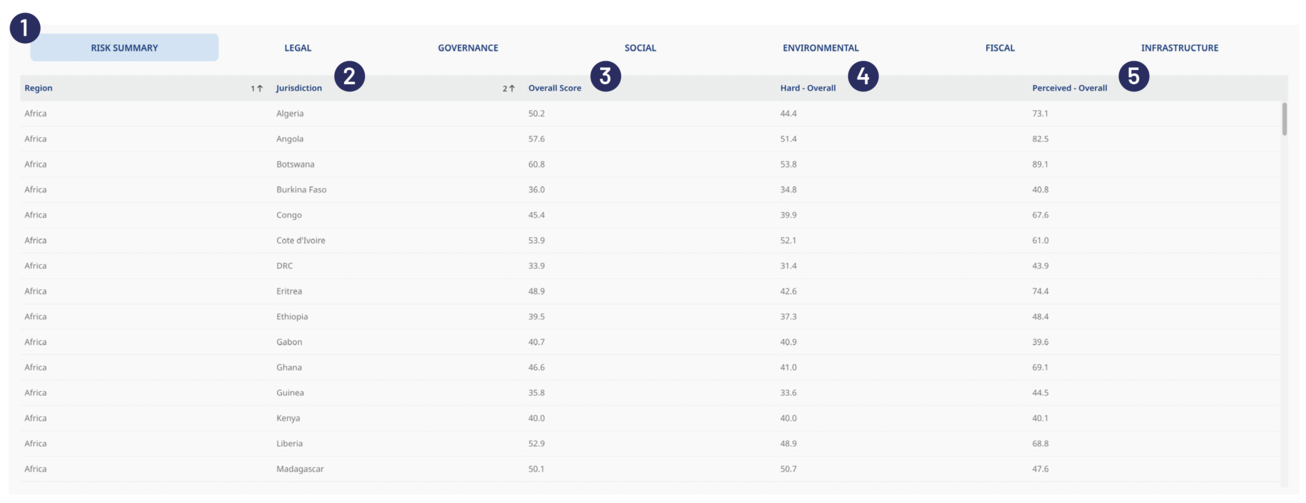
- Navigation bar for different tables. There is one for overall risk scores, followed by six for each risk category.
- The section on the left details the jurisdiction and its region corresponding to the row. Note, these are not hyperlinked to subsequent pages.
- The overall score for the selected tab and jurisdiction row.
- Hard risk score broken down into each raw element, which themselves are turned into a score.
- Perceived risk score broken down as above, and in the same order as the hard risk scores.
Below the detailed risk score table, users can find regional snapshots. Each of the nine regions has a dedicated section to summarise their scores and provide any relevant updates via analyst commentary.
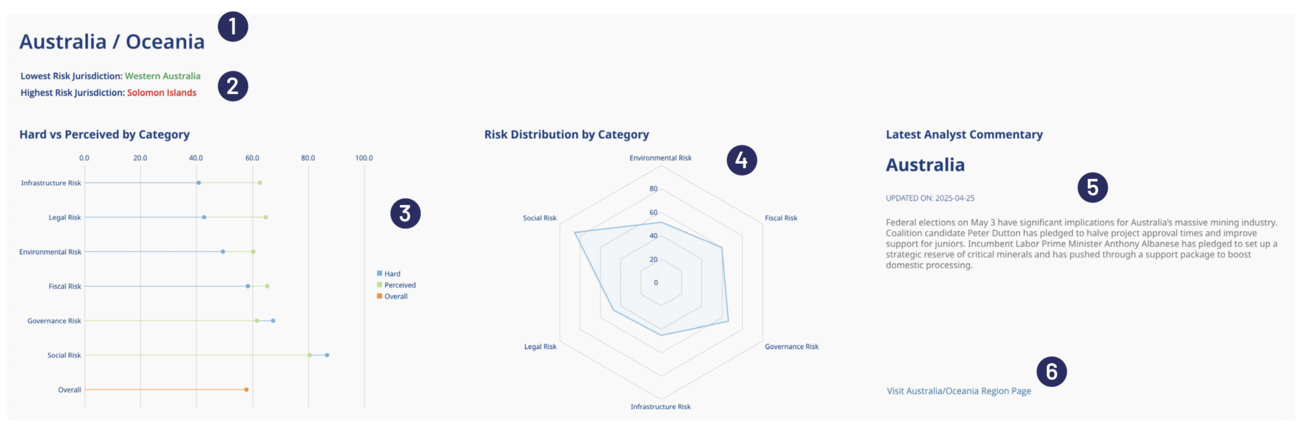
- Region strip title.
- Quick reference to the lowest and highest risk jurisdictions in the region. These work as hyperlinks to their corresponding jurisdiction pages.
- Lollipop chart showing the spread between aggregated hard and perceived risk scores against each category, with a comparison to the overall average. Hovering over elements of this will show the exact aggregated scores.
- Radar chart plotting the aggregated score for the region against each risk category. Hovering over elements of this will show the exact aggregated scores.
- Latest Mining Journal analyst commentary against the region or any jurisdiction within, detailing any recent events which may impact the scores upon the next report's release.
- Hyperlink to the region or jurisdiction page most relevant to the commentary.
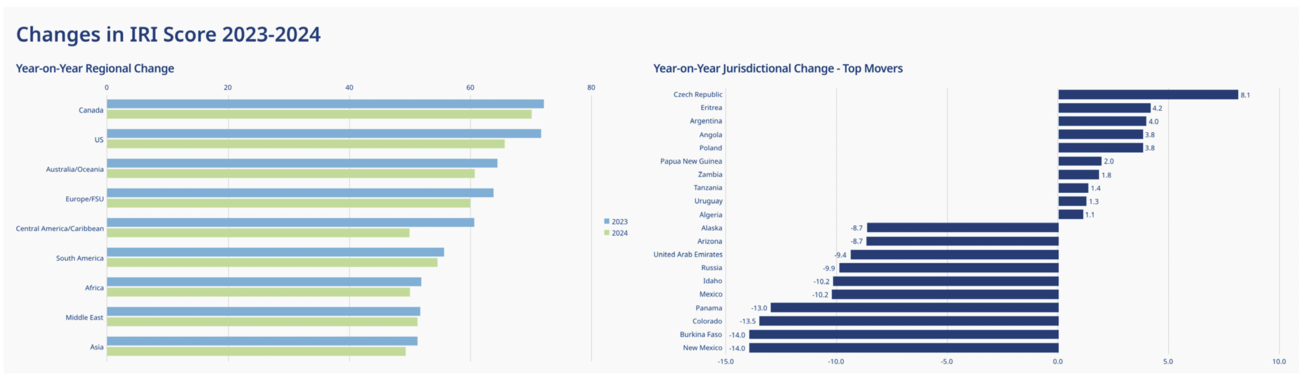
The final section at the bottom of the World Page gives a brief overview of score changes from the prior year's report. The jurisdictional change only displays the 10 most improved and 10 most decreased jurisdictions year-on-year.
RISK BY REGION PAGE
This page relays information around regional results, aggregated from their individual jurisdictions. On this page (and the The Risk By Jurisdiction page), the region and risk elements of focus can be edited by the user.
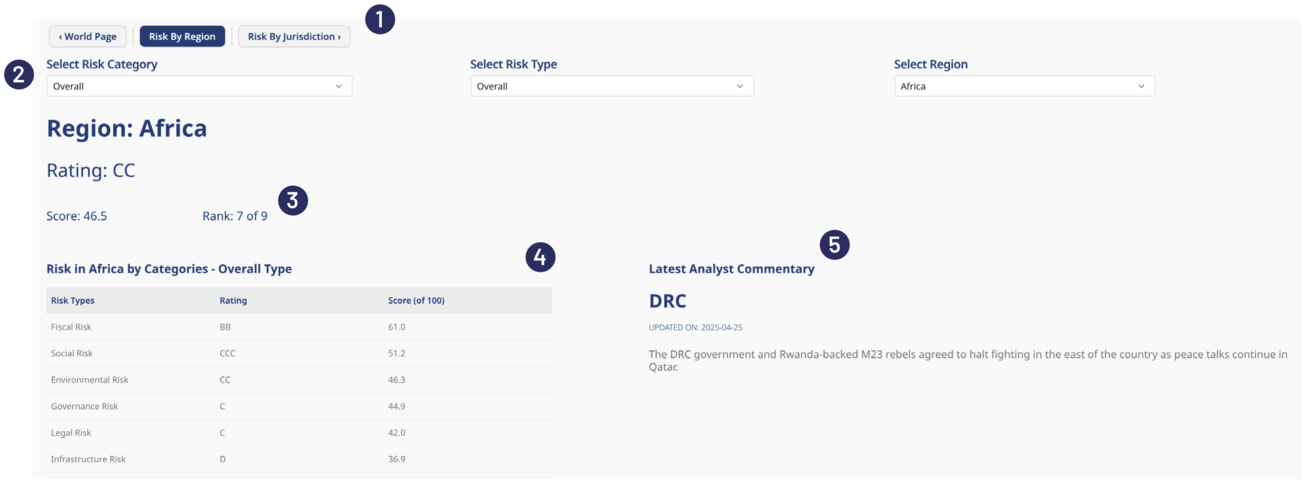
- As with the World Page, the same buttons appear here in the same position to allow navigation back to the world page or forward to the jurisdiction page. If going forward from here via this button, the first alphabetical jurisdiction within the region is selected, as well as the selected category and risk type.
- Filters available to the user to filter the dashboard view below. Some charts are designed to ignore some of these filters if they have already broken them down.
- Top-line results for the selected region. These results change based on all filter selections.
- Breakdown of the risk categories in the selected region, aggregated from all jurisdictions.This table ignores the "Risk Category" filter since it already breaks the view down.
- As with the region strips of the World Page, it contains the latest Mining Journal analyst commentary against the region or any jurisdiction within, detailing any recent events that may impact the scores upon the next report's release.
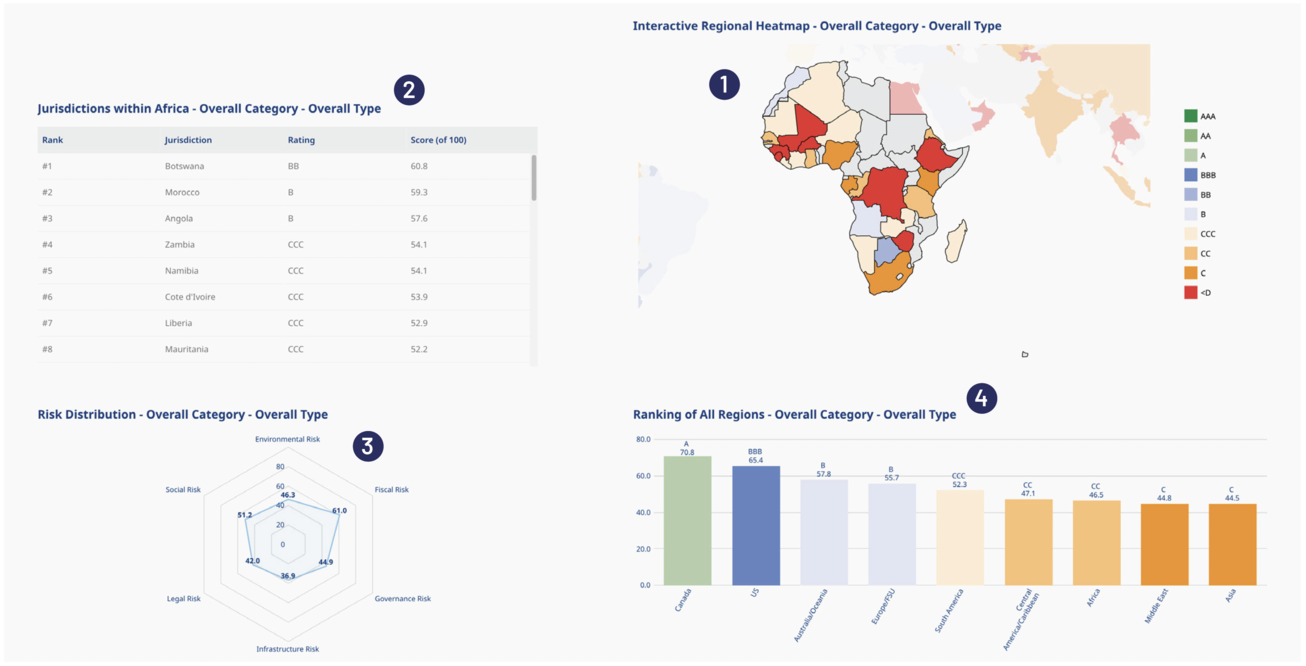
- Interactive map showing the scores given to each jurisdiction under the region. Jurisdictions without a score will appear grey here. Jurisdictions in other regions can also be seen in lighter shades. Hovering over any jurisdiction on this map will provide a tooltip giving score details based on the selected filters. Clicking on any jurisdiction within this map will take the user to the corresponding jurisdiction page, including those in other regions, keeping the selected category and type filters.
- Table providing a breakdown of each jurisdiction's score and rating within the selected region and filters.
- Radar chart plotting a breakdown of the risk categories. This chart type will be used for cross-regional comparisons in the future. It ignores the risk category filter selection.
- Bar graph ranking all regions given the selected filters. This ignores the selected region filter, as it shows all at once.
RISK BY JURISDICTION PAGE
The Risk by Jurisdiction page is the most granular view available in Mining IQ Risk Analytics. It provides similar views, comparisons, and functionality as the previous region page.
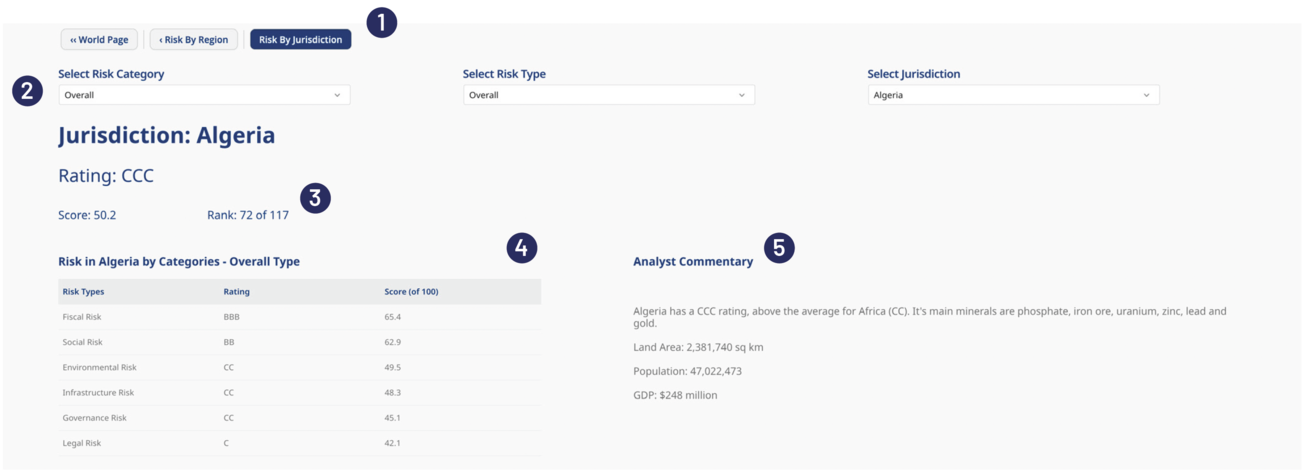
- As in the other pages, the same buttons appear here in the same position to allow navigation back to the World page or Risk by Region page. If going back to the region page from here via this button, the currently viewed jurisdiction's region will be selected, as well as the selected category and risk type.
- Filters available to the user to filter the dashboard view below. Some charts are designed to ignore some of these filters if they have already broken them down.
- Top-line results for the selected jurisdiction. These results change based on all filter selections. The rank is out of all global jurisdictions.
- A breakdown of the risk categories in the selected jurisdiction. This table ignores the "Risk Category" filter since it already breaks down the view.
- Contains the latest Mining Journal analyst commentary against the selected jurisdiction detailing any recent events that may impact the scores upon the next report's release. For Canada, USA, and Australia, the commentary may be the same across all their jurisdictions if relevant at the federal level. The commentary here also displays additional general information about each jurisdiction uniquely.
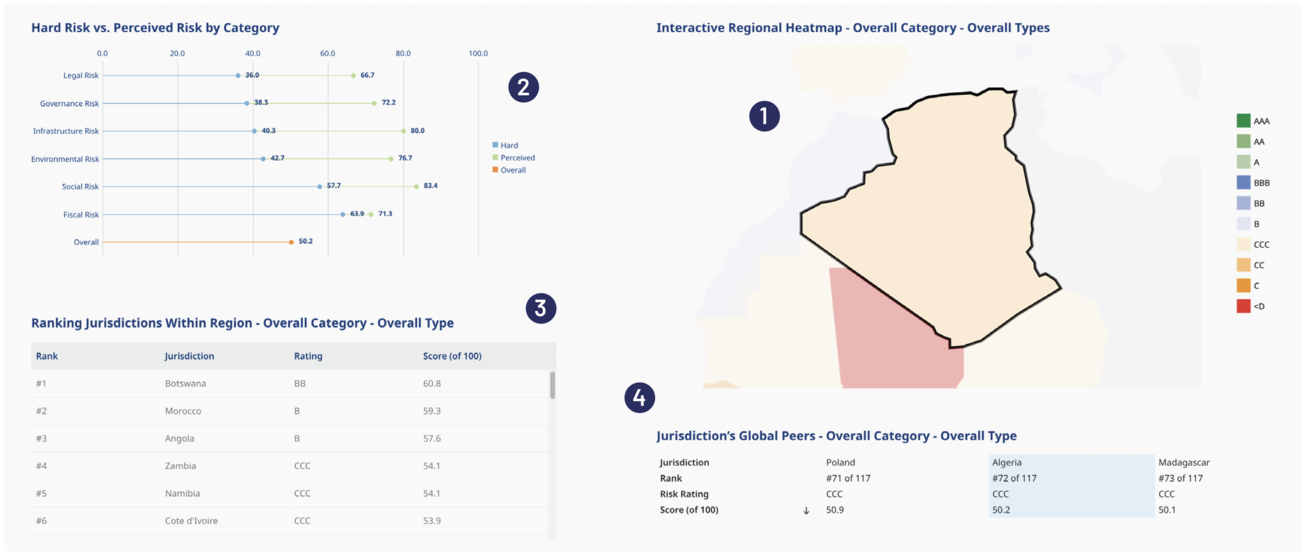
- Interactive map showing the selected jurisdiction's colour coding, as well as those of nearby neighbours in lighter shades. Jurisdictions without a score will appear grey here. Hovering over any jurisdiction on this map will provide a tooltip giving score details based on the selected filters. Clicking on any jurisdiction within this map will refresh the view to what was selected, effectively being an identical action to changing the jurisdiction filter near the top.
- Lollipop chart showing the spread between hard and perceived risk scores against each category, with a comparison to the overall average. This chart will only respond to the jurisdiction filter and not the others, as it provides a full breakdown.
- Table providing a ranked comparison of all jurisdictions with the region based on the selected filters.
- Global Peers view shows the two jurisdictions immediately above and below the selected jurisdiction at a global level, ranked by score, and based on the selected filters.
For support with Risk Analytics or further information on the product or methodology contact us at miningiq@aspermont.com